Channel Performance & Analytics
GIPHY Engagement Rate Benchmarks: Proven Channel Performance & Analytics
Most creators stop at view counts. Here's how GIPHY calculates true engagement and real analytics from a channel hitting 20%–67% selection rates.
Real data from the Aquafaba Test Kitchen GIPHY Creator channel, paired with an honest explanation of what engagement rate actually means and why it matters for brands.
Proof of concept
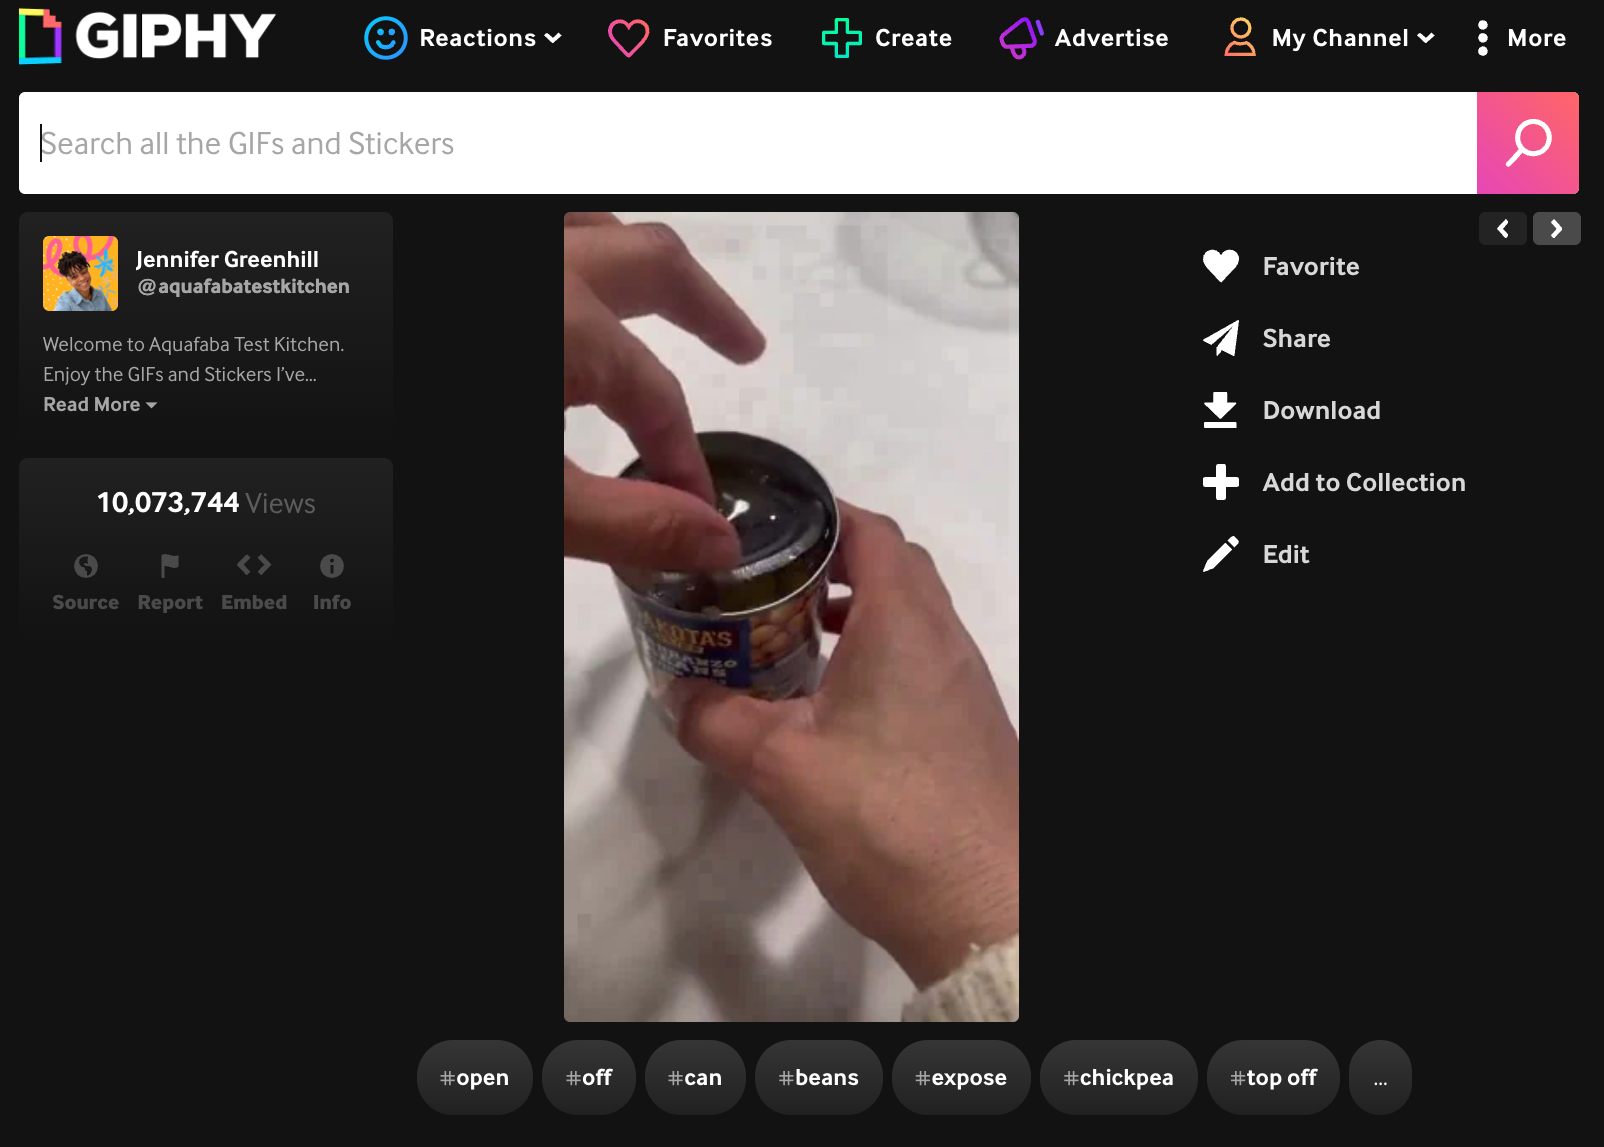
10M+ views. A can of Bush's chickpeas. No campaign.
This GIF of Jennifer opening a can of Bush's branded chickpeas while testing an egg-free recipe, was never a paid placement. It was created organically as part of everyday content. It now carries a 67.7% engagement rate and over 10 million views, with the Bush's label visible every time someone selects or shares it. That's passive brand visibility inside real conversations, at scale, without effort from the brand.
How GIPHY calculates engagement rate
Unlike traditional social platforms that measure likes or comments against follower counts, GIPHY Analytics tracks search intent and selection behavior. The metric functions as a search click-through rate; how often users choose your GIF when it appears in results.
The formula
GIPHY divides the total number of times users select (click or share) your GIF or sticker in search by the total number of times it was served in search results.
Data sampling
View counts reflect GIPHY's entire network, whereas engagement rate data is calculated from a sample of partner integrations and accessed via the Download Full CSV option on upgraded brand or artist dashboards.
Algorithmic impact
High selection and share rates signal relevance to GIPHY's search algorithm, pushing the asset higher in search rankings for that keyword. High scroll-past rates push it down.
Keyword context matters
A broad, high-volume tag like 'happy' naturally yields a lower selection percentage than a niche, branded tag. Performance is best evaluated against your own channel baseline and keyword type.
GIPHY engagement rate benchmarks
Because GIPHY doesn't publish official industry benchmarks, these tiers are derived from channel-level data and comparative analysis across creator dashboards.
50%+
Exceptional / Outlier
Niche or branded search terms, viral breakouts, or smaller sample sizes. Two out of three users who see the GIF actively choose it.
30%–49%
Very Strong
Top-performing reaction GIFs winning crowded search walls. Nearly one in three users selects or shares the content.
20%–29%
Healthy / Above Average
Solid, consistent performers holding steady visibility on broad, competitive tags. One in four to one in five users selects the content.
Under 15%
Average to Low
High-competition generic tags or assets that may benefit from stronger visual hooks or more targeted tagging strategy.
Where this channel lands
The Aquafaba Test Kitchen GIPHY Creator channel has GIFs performing across multiple tiers; including outlier-level engagement rates on specific assets.
67%
Peak engagement rate
Exceptional / OutlierRoughly two out of every three people who see this GIF in search results actively click or share it; well above typical visual search benchmarks.
30%
Strong performer rate
Very StrongNearly one in three users selects or shares the content. On high-volume competitive tags, this rate drives more total selections than a 67% rate on a niche term.
20%–27%
Consistent channel baseline
Healthy / Above AverageMultiple assets consistently hitting this range indicates a reliable creative formula. On a search wall packed with competing options, being chosen 20%–27% of the time is strong performance.
Channel overview
1Billion+
Cumulative views
Total times content from this channel has been loaded across GIPHY's platform and partner integrations since 2021.
816
GIFs & stickers uploaded
Original pieces of content created and distributed through the channel.
2021
Active since
Three-plus years of consistent content creation, tagging, and discoverability strategy.
What this means for your brand
A 20%–67% selection rate isn't just a number. It means that when a custom GIF is created and tagged for your campaign, users actively choose and share it rather than scrolling past. That's the difference between content that circulates and content that sits.
GIPHY distributes through search, not a follower feed. Content appears inside conversations, in iMessage, WhatsApp, Instagram DMs, Threads, X (Twitter) replies. A high engagement rate means your brand is embedded in the exchange itself, not running alongside it as an ad.
The compounding effect matters too. When a GIF maintains a strong engagement rate, GIPHY's algorithm moves it higher in search results for its target tags; which increases daily views, which reinforces the ranking. Content that earns its place keeps earning it.
Engagement rate data is sourced from GIPHY Creator channel analytics CSV exports. Figures represent point-in-time snapshots and reflect a sample of partner integrations, not total network views. Individual asset performance varies by tag specificity, impression volume, and search term competition. These figures represent historical channel performance, not a guarantee of future results for any collaboration.
Put a high-engagement channel to work for your brand.
Let's talk about what a GIPHY distribution collaboration could look like and what a 20%–67% selection rate means for your content.
Start a conversation